5 Computers Matter
The Relevance of Computer Log Data for Understanding Associations Between Digital Media Use and Well-Being1
5.1 Abstract
Research on digital media and well-being increasingly relies on smartphone log data to overcome limitations of self-reports, but often ignores computer use, implicitly treating it as less relevant. This study examines this assumption using experience sampling data from 106 participants who reported mood six times daily over two weeks (7,442 observations) alongside passive smartphone (499,696 events) and computer (257,362 events) logs. Results show that including computer use in analytical models significantly alters the pattern of findings. Including computer use increased individual and aggregate screen time estimates by an average of 136% relative to smartphone measures. Cross-device behaviors, such as sequential and overlapping use, were widespread, with participants switching devices on average 66 times per day. Models predicting daily and momentary mood were substantially altered when computer and cross-device metrics were included. These findings demonstrate that computers matter and underscore the need for multi-device data collection to improve validity of digital media effects research.
Keywords: digital trace data, computational methods, smartphone use, computer use, behavioral data, well-being
5.2 Introduction
Media scholars increasingly leverage smartphone log data to test theoretical claims about the impact of digital media use on health and well-being. This methodological shift is largely motivated by a desire to overcome the limitations of traditional self-report methods, such as recall bias, social desirability, and inconsistencies in self-reporting, which threaten the reliability and validity of findings (Sewall et al., 2020; M. Vanden Abeele et al., 2013). Indeed, a growing body of literature demonstrates that self-reports of smartphone use are inaccurate: When comparing self-report data with log data, for instance, studies find only moderate correlations concerning the duration and frequency of smartphone engagement (Molaib et al., 2025; Parry et al., 2021; Tkaczyk et al., 2024). This is partly due to smartphone use often taking place in the form of short and frequent interactions, and this across multiple apps or platforms, which makes detailed assessments of usage frequency and duration difficult to provide (Parry et al., 2021). Moreover, studies also show that the above inaccuracies in measurement are not random but vary systematically. For instance, heavy users are more likely to underestimate their use and vice versa (cf. regression to the mean (M. Vanden Abeele et al., 2013)), and self-report estimates are more inaccurate among individuals with lower psychosocial well-being (Sewall et al., 2020).
Because solely relying on self-reports of digital media use can lead to distorted findings and misleading conclusions (Kaye et al., 2020; Sewall et al., 2022), researchers increasingly turn towards passive monitoring of digital media behavior as the ‘gold standard’. After all, the advent of device logging, combined with the computational turn in the social sciences, provides a unique opportunity to address several of the limitations of self-report data. Passively gathered device data offer richer, more reliable insights into media behaviors while also reducing participant burden. For instance, passive smartphone logging allows for precise measurement of smartphone usage patterns, both temporal and at the app-level, and this in a naturalistic setting (Ryding & Kuss, 2020). Collecting log data over extended periods of time also enables researchers to investigate within-person fluctuations, allowing for more nuanced and dynamic relationships to be modelled (Marciano et al., 2022; Sewall et al., 2022), thereby taking into account different temporal resolutions (Klingelhoefer et al., 2025). Moreover, researchers can identify and extract more complex and granular patterns from the data, such as features representing the fragmentation and ‘stickiness’ (Aalbers et al., 2021; Brinberg et al., 2023; Deng et al., 2019; Siebers et al., 2024) or ‘burstiness’ (Jo et al., 2012; Peng et al., 2020) of media use.
The above evolutions are important because, to date, there has been a tendency among researchers to rely on a limited set of cruder operationalizations when leveraging log data. More specifically, scholars often aggregate detailed log data into metrics such as daily screen time or frequency of use and incorporate only these aggregates as predictors in their analyses. Although useful for capturing broad trends, this approach risks obscuring important nuances in digital behavior (M. M. P. Vanden Abeele, 2021) and may increase the likelihood of type I (mistakenly detecting effects where none exist) and type II (not finding effects that do exist) errors. Alternative strategies, such as analyzing app-specific usage, exploring different temporal resolutions (e.g. fragmented vs. sustained use), or conducting sensitivity analyses, could provide a more robust test of the underlying theory. Rodman et al. (2024) provide empirical support for this claim, demonstrating that while overall smartphone use showed very weak or no associations with well-being, more granular features—such as engagement with distinct categories or platforms—were more predictive. Differentiating between distinct digital activities is seen as a crucial prerequisite for studies incorporating screen time measures. This is also argued by Meier & Reinecke (2021) who warn against treating digital media as a homogenous construct and failing to account for differences in applications, features and interactions. Similarly, Kaye et al. (2020) propose shifting away from screen time towards screen use, focusing on the behaviors facilitated by digital devices, rather than simply measuring the time spent on them.
In sum, the increasing use of log data is generally considered a major leap forward for the field of research on digital media effects (Parry & Klingelhoefer, 2025). However, despite bringing obvious benefits, there is currently one major caveat that may compromise robust tests of theory, namely that log data are often collected from only one, or a limited type of devices, most commonly the smartphone, potentially leading to an incomplete picture of individuals’ overall media behavior. Several studies have highlighted this limitation. For instance, a meta-analysis by Parry et al. (2021) found that nearly all studies investigating log-based digital media use relied exclusively on smartphone data, with only a handful of studies incorporating passive sensing data on the use of computers, gaming devices or general internet use. Liu et al. (2024) also highlighted the importance of distinguishing between the type of digital media use when assessing their impact on well-being but did not account for differences in device use. Similarly, Verbeij et al. (2022) found that digital log measures of social media were as predictive as self-reports but explicitly acknowledged that the log data were limited to smartphones, thereby excluding any usage on tablets, laptops or web-based versions of social media platforms.
This methodological limitation raises concerns: Research relying solely on smartphone data may underestimate people’s digital engagement and may be blind to how particular (cross-)device features might potentially impact well-being. For instance, in another illustrative study, Schenkel et al. (2024) found that smartphone email app use was negatively associated with morning positive affect, while chat app use was negatively related to evening positive affect. But, as the authors also acknowledge themselves, by focusing on smartphone data alone, the study likely overlooks important contributions from other devices, most notably the computer or laptop, which especially in an adult, employed sample are devices crucial for many users in managing email and chat communication. Indeed, daily computer use is extensive - in many instances likely comparable to or even surpassing smartphone use. Thus, to regard not capturing computer log data as a rather minor limitation seems problematic. By failing to capture computer-based log data alongside smartphone log data, the results and conclusions of research may not just be a little inaccurate—such that point estimates are a little off, or the confidence intervals a little wide—but rather very inaccurate, such that point estimates can be way off, and even in the opposite direction. Moreover, there seems to be a dearth of research highlighting the affordances a multidevice approach may offer, as there is ‘media multiplexity’ in people’s daily media repertoires (Haythornthwaite, 2005). By additionally capturing computer screen time, for instance, it becomes possible to identify device switching dynamics and tendencies to employ multidevice workflows. These insights could have various theoretical insights, for instance in the context of novel theorizing around media multitasking (Abrahamse et al., 2025).
Accordingly, the aim of the present study is to more clearly underline the true extent of the impact, both on research findings and theory, when computer log data is leveraged alongside smartphone log data. We do this by first describing how accounting for computer/laptop use log data changes ‘screen time’ measures. Second, we examine whether—and how—the inclusion of these computer-based log data (both as stand-alone predictors and in combination with smartphone log data (i.e. cross-device features)) might affect conclusions regarding the relationship between digital media use and individual outcomes. To prove our point, we leverage data from a large-scale, two-week experience sampling study, that measured subjective wellbeing (and other) constructs six times a day while logging participants smartphones and computer use. In this study, we specifically examine the mood data (i.e., how happy and ‘down’ participants felt) that was captured, given several studies have explored associations between passively sensed smartphone use and mood (Balliu et al., 2024; Pratap et al., 2019), but without accounting for computer/laptop use.
5.3 Methods
5.3.1 Participants
This study draws from an experience sampling project that recruited 1,315 participants to investigate the link between digital media use and wellbeing, which was conducted from October to December 2022. Here, we leverage data from 106 participants (Male: 49%, Female: 48%, other: 3%), with a mean age of 39.4 (SD = 11.0), most of whom were highly educated (Bachelor’s degree or higher: 94%, High school degree: 5%, Lower: 1%) and in full-time employment (75%, Student: 7%, Other: 18%), that additionally provided smartphone and computer log data alongside their ESM data. These participants contributed 499,696 smartphone, 257,362 computer, and 7,442 ESM datapoints.
5.3.2 Procedure
The project received approval from the IRB of Ghent University Faculty of Political and Social Sciences (code 2022/11). Written (digital) informed consent was asked during the onboarding process: when signing up, and during installation of each smartphone app used in this research. Consent was required before any of the research tools could send out questionnaires or gather data. All study procedures were conducted in accordance when Ghent University guidelines.
Participants registered for the research online, and installed two smartphone applications2: one that provided them with ESM questionnaires (m-Path; www.m-path.io), and one that monitored their smartphone log data (MobileDNAPlus; e.g., screen time, number of notifications received). Participants also installed ActivityWatch (https://activitywatch.net/) on their computer, which passively captured their screen time.
During their two-week participation, six questionnaires were sent out daily via the m-Path app, between 07:30-09:00 hrs, 10:15-11:45 hrs, 13:00-14:30 hrs, 15:45-17:15 hrs, 18:30-20:00 hrs, and 21:15-22:45 hrs. These time slots were separated by a period of at least 1 hr 15 min and at most 4 hr 15 min. Following the initial notification, each ESM questionnaire remained available to complete for 45 min. Participants received a reminder notification if the questionnaire had not been responded to 30 min after the initial notification. Participants answered the same mood items during each ESM questionnaire they completed. Throughout the two-week period, the MobileDNAPlus app and ActivityWatch tracked screen time events: timestamped app use and notifications on the smartphone, and timestamped computer program use on their computer. Log data were processed into different features and aggregated at two time-intervals: at the ESM questionnaire window interval, and at a daily interval.
5.3.3 Measures
Self-report
Mood was measured using two items, both containing the stem “Since getting up this morning…” (first questionnaire received each day) or “Since the last beep…” (the five remaining questionnaires received each day): “…I felt happy” and “…I felt down.”. Both items had a 7-point Likert scale ranging from 1 (‘Not at all’) to 7 (‘All the time’).
Smartphone and Computer Log data
Device usage was aggregated into separate measures per device, and per category of use. All smartphone apps, computer programs and browser titles were categorized, of which we included four labels in this study: email (e.g.: Outlook, Gmail), work (e.g.: Excel, Word), social (e.g.: Facebook, Instagram), and chat (e.g.: WhatsApp, Signal).
Duration sums the total screen time, and total screen time per category. Frequency sums the total amount of app launches, and again per category. Fragmentation looks at the dispersion of these two dimensions across time: A low value signifies less time was spent on the device/category and this across fewer usage sessions, while a high value indicates that more time was spent and this in frequent and short bursts (refer to Siebers et al., 2024 for more information). In total, this led to forty-five different variables: three features across five categories (total, email, work, social, chat) and three device (smartphone, computer, combined) levels.
Additionally, we calculated three cross-device features, based on both smartphone and computer log data. Figure 5.1 contains an example of how each feature was calculated.
Device switching, which counts the number of times a participant alternated between devices during a combined usage session, or when they stopped a device session and immediately started a new usage session on a different device. Our example shows three device switches taking place, twice originating from smartphone use (1, 3) towards computer, once from computer use (2) towards smartphone.
Context switching, where we counted the number of times a device switch also meant a change of context, i.e.: the category of use on device A was different than the category of use on device B. For example, while having an email client active on the computer, the number of times a non-email smartphone session was started. Our example shows a longer period of email use on the computer, and three separate smartphone sessions, of which two were seen as context switching. The first from email to social media, the second from email to chat.
Overlapping device use, which takes the proportion of device time where device A and device B were active at the same time. For example, take a one-hour time window which a user spent working on their computer, and during this time spent six minutes using social media on their smartphone, the computer overlap percentage would be 10%, while smartphone overlap percentage would be 100%. Finally, the figure shows the same example of device switching, but this time highlights the period where we consider overlapping device use to be present. Both computer and smartphone use total eight minutes, of which one minute overlaps. Hence, 12.5% of screen time would here be considered as overlapping.

The top panel illustrates device switching, showing sequential transitions between smartphone and computer use. The middle panel illustrates context switching, where a device switch coincides with a change in category of use (e.g., from computer email use to smartphone chat or social use). The bottom panel illustrates overlapping device use, showing periods where both devices are active simultaneously.
5.3.4 Data Analysis
Data processing and preparation was carried out using the Python Polars package (The Polars Development Team, 2025) and dplyr R package (Wickham et al., 2025). Descriptive statistics were calculated using the same Polars package. This resulted in a momentary dataset – where each feature was calculated per ESM time window, which were semi-randomized with an average of 3h 4m in between – and a daily dataset, where each feature was calculated at a daily time window.
Associations between Mood and Device Use were modeled using Linear mixed-effects models in the R package lme4 (Bates et al., 2015). Momentary models used the raw mood variable (feeling happy, feeling down), while device use variables where within-person scaled (i.e.: each participant’s average was 0, with a standard deviation of 1) to allow for easy comparison. Daily models used the average daily mood and again within-person scaled device use variables.
We employed two tailed testing and considered effects significant if p-values were .05 or less.
5.3.5 Transparency and Openness
Materials and code used for this study can be accessed on our Online Science Framework (OSF) page: https://osf.io/fzmjx/overview?view_only=3e80e078d4354722a2a6773cb6479d34.
5.4 Results
In this section, we demonstrate how including computer-based log data reshapes both the descriptive conclusions about digital media use and inferential conclusions about its associations with mood. We start of by showing how total and categorical estimates of screen time change markedly when computer data are incorporated. Next, we show how employing a multi-device perspective reveals insightful cross-device dynamics (from device switching or multitasking), which cannot be gleaned from smartphone data alone. Finally, we demonstrate how additionally including computer log-data impacts inferences about the relationship between media use and affect.
5.4.1 Screen Time is More Than Smartphone Time
To date, most research incorporating device log data has predominantly operationalized ‘screen time’ as the aggregate of time spent on the smartphone. Our findings reveal that this assumption underestimates people’s digital engagement and misrepresents how screen time is distributed across devices. Within our sample, for instance, participants spent an average of 2h 5min interacting with their smartphone (see Figure 5.2), with the minimum and maximum daily average being 13min and 6h 22min, respectively. However, within our sample, participants spent an average of 2h 10min interacting with their computer, an amount essentially on par with smartphone use. Considering workdays only, participants used computers more still, with screen time averaging 2h 20min per day, while smartphone screen time dropped to an average of 1h 51m. For daily computer use, minimum and maximum were 2 minutes, and 12 hours and 13 minutes daily.
But most important is the impact of capturing both smartphone and computer screen time. Our analyses reveal that participants spent an average of 4h 15min interacting with both their smartphone and computer combined, which represents an 136% increase in screen time relative to the smartphone alone. Interestingly, our analyses also reveal more variance in participant screen time relative to logging the smartphone alone (SD = 136.1 vs 68.5). Moreover, our analyses reveal that just because participants have similar smartphone screen time, that it does not follow that their overall screen time will be similar. Indeed, Figure 5.2 shows four participants from our sample with near identical smartphone screen time, displaying very different computer use time, and thus combined screen time: For some participants, such as the participant highlighted in red, including a second device marks a large increase in total daily screen time, while for others – such as the participant highlighted in yellow – these changes are less pronounced.
In sum, our findings concerning screen time alone represent a critical reason for additionally logging participants’ computers. They not only show that sample and population screen time estimates will be substantially underestimated without computer logging, but they also demonstrate that participant patterns within devices may paint a markedly different picture. On this point, if screen time did exert a negative effect on wellbeing, a participant that gets most or all of this via their smartphone would contribute valuable data to a study that only logged smartphones. In contrast, a participant that gets much of their screen time through their computer would add a lot of error, and more problematically, bias to the model, for a substantial amount of their screen time simply would not get measured. However, differences in screen time represent but a small part of this story.

The left panel shows individual-level averages for each participant, with lines connecting each participant’s smartphone, computer and combined screen time, visualizing within- and between-person differences. Four participants with similar smartphone screen time are highlighted in color to illustrate how overall screen time diverges once computer use is included. The right panel displays boxplots summarizing the distributions of participant screen time across devices, highlighting differences in central tendency and variability.
5.4.2 Devices Shape What We Measure
Including computer log data also markedly impacts the story of how people engage with specific categories or platforms. For instance, imagine we are interested in how spending time emailing impacts our mood. It is possible, given that smartphone logging is so easy relative to computer-based logging, to believe one may be able to gain valuable insights from smartphone log data alone. As Figure 5.3 highlights, this may be true for participants who deal with their emails primarily using their phone. However, for the majority that use their computer to receive and deal with a sizeable number of their emails, any analyses would be severely hindered from the outset. The same goes for research that attempts to gain insights on the impact of emails exclusively from computer-based logging, given the increased ease at which emails can be accessed and dealt with via the smartphone. Overall, our analyses reveal that if we relied only on smartphone log data, we would be missing out on more than half of all email screen time (mean phone = 42.2%, mean pc = 57.8%).

Each horizontal bar represents a single participant, with blue segments indicating the proportion of computer email screen time and yellow indicating the proportion of smartphone email screen time. Participants are ordered by their proportion of computer vs smartphone screen time. The figure demonstrates substantial between-person heterogeneity, with a large proportion of total email screen time taking place on the computer. This includes the 86 users of whom we had at least 3 days of smartphone and laptop data (each horizontal bar represents a single individual’s distribution).
Taking additional app categories into account, we find large differences in the proportion of their screen time over the two examined devices: social media (mean phone = 62.9%, mean pc = 37.1%), chat (mean phone = 92.1%, mean pc = 7.9%), and work (mean phone = 24.9%, mean pc = 75.1%). This picture is similar when investigating specific platforms like Facebook, X, or Instagram. As an example, Figure 5.4 shows a timeline plot of a participant’s engagement with Facebook during a single day. We see that, although they begin using Facebook on their computer, they frequently switch towards their smartphone in the afternoon and evening. Including additional devices allows us to investigate these different media habits more comprehensively. From a theoretical standpoint, this matters because when we operationalize ‘social media use’ or ‘email use’ solely through smartphone data, we could ignore substantial and distinct proportions of those media use practices.

Vertical bars indicate periods of active use on the computer (blue) and smartphone (yellow), illustrating how social media engagement is not limited to a single device and highlighting the cross-device nature of this type of activity.
5.4.3 Beyond Duration: Cross-Device Dynamics
Apart from more accurately assessing someone’s screen time and app usage, including multiple devices allows us to show how people juggle these devices throughout the day, coordinating tasks and attention across screens. Specifically, we can investigate patterns of sequential and multi-tasking use, assessing how often people switch devices and contexts, what proportion of their device’s screen time overlaps, and how often they engage in these types of behaviors. Doing so may offer important theoretical insights that screen time alone is unable to provide, and is in line with recent calls to go beyond aggregate measures to ensure a better test of theory (Parry & Klingelhoefer, 2025). For more information on how we calculated these metrics, please refer to the Methods section.
First, we examined how often participants transition from one screen to another. On average, participants switched devices approximately 66.15 times per day (SD = 54.80, median = 52), with this behavior occurring on around 60% of all study days. This frequent toggling underscores that media engagement is rarely limited to a single device. From a measurement standpoint, this means that studies focusing on a single device likely capture only fragments of a broader digital routine.
Next, we examined overlapping use, or moments where both devices were active at the same time. Despite occurring less frequently than sequential use, overlap was far from rare: on days where participants used both devices, 18.4% (SD = 24.1) of computer use and 14.2% (SD = 17.2) of smartphone use was concurrent with the other device. This finding suggests that multi-device multitasking, such as working on the computer while simultaneously checking your smartphone, is a common behavioral pattern. This overlap reveals not just concurrent attention, but also potential concurrent cognitive or affective demands, which may influence well-being in ways single-device data cannot detect.
We further analyzed context switches, capturing moments where a device switch also entailed switching between categories of media activity (e.g.: from computer email software to a smartphone chat application). On average, participants made 59.45 context switches per day (SD = 49.87, median = 46), indicating frequent alternation between platforms and activities. Notably, nearly 90% of device switches also involved a context switch, meaning that device transitions almost always implied shifting what one was doing, not merely where. This high coupling of device and context changes highlights that device switching can often entail a reorientation on cognitive or situational levels, potentially shaping attentional and emotional outcomes.
Taken together, these cross-device metrics reveal that digital media use is not only distributed across devices but dynamically structured in time. By capturing switching, overlap and context transitions, we can uncover a layer of media behavior that single-device studies cannot observe. This not only improves our understanding of how people engage with screens, but also enables more precise tests of theoretical mechanisms, such as multitasking or attentional fragmentations, that depend on the interplay between devices.
Having established these dynamics, we next examine how they relate to affect well-being, testing whether these multi-device patterns help explain momentary and daily mood fluctuations.
5.4.4 Multiple Devices, Multiple Stories
Having established that computer use is both substantial and intertwined with smartphone activity, we now examine how these patterns translate into differences in affective experience. Specifically, we test whether including computer-based and cross-device features change the observed relationships between digital media use and mood. In doing so, we show that the scope of data, whether limited to smartphones or extended to multiple devices, can influence both the direction and strength of media effects estimates. Figure 5.5 and Figure 5.6 visualize how the inclusion of computer and combined device data reshape associations with mood.
Models using only smartphone data revealed few and inconsistent associations between digital use and mood. For happiness, only a handful of momentary associations emerged, such as minor negative links with email and work-related use, and a small positive link with chat frequency. In addition, all day-level associations were non-significant. Similarly, models predicting feeling down found some positive associations with total, email and social smartphone use, but these effects were small in magnitude. At the daily level, small effects for total, email and work-related use were also found. These patterns replicate what we already know from prior research using smartphone log data: There is limited evidence for strong mood effects, and effects are inconsistent across categories of use.
When we adapted our models to use the computer-based metrics, the picture changes notably. At the momentary level, all computer features showed a significant negative association with feeling happy, while at the day-level these associations remained for total, email and work categories. When modelled for feeling down, significant positive associations were found for all categories of use, except chat, both at the momentary and day-level. In other words, on days and moments of heavier computer use, participants reported slightly lower positive affect. This pattern was more consistent and robust than those found in the smartphone-only models.
This divergence demonstrates that different devices capture different experiences and contexts. What appears neutral or weakly related to mood on smartphone may signal strain, workload or mental fatigue when observed via computers.
When smartphone and computer measures were combined, several effects changed significance. Daily total device frequency, which was negatively related to happiness in computer models was no longer significant in the combined device model. At the momentary level, combined social media use duration and frequency were no longer significant compared to computer models, while on the day-level fragmented patterns of combined social media and chat use now emerged as new, significant predictors of lower happiness. The fragmented nature of combined daily chat use now also showed a significant positive association with feeling down. This highlights the importance of looking beyond how much, and additionally consider how fragmented and cross-device screen time occurred. These shifts between device models underline that our conclusions about digital well-being are not fixed properties of the phenomenon but a result of how comprehensively we choose to measure it.
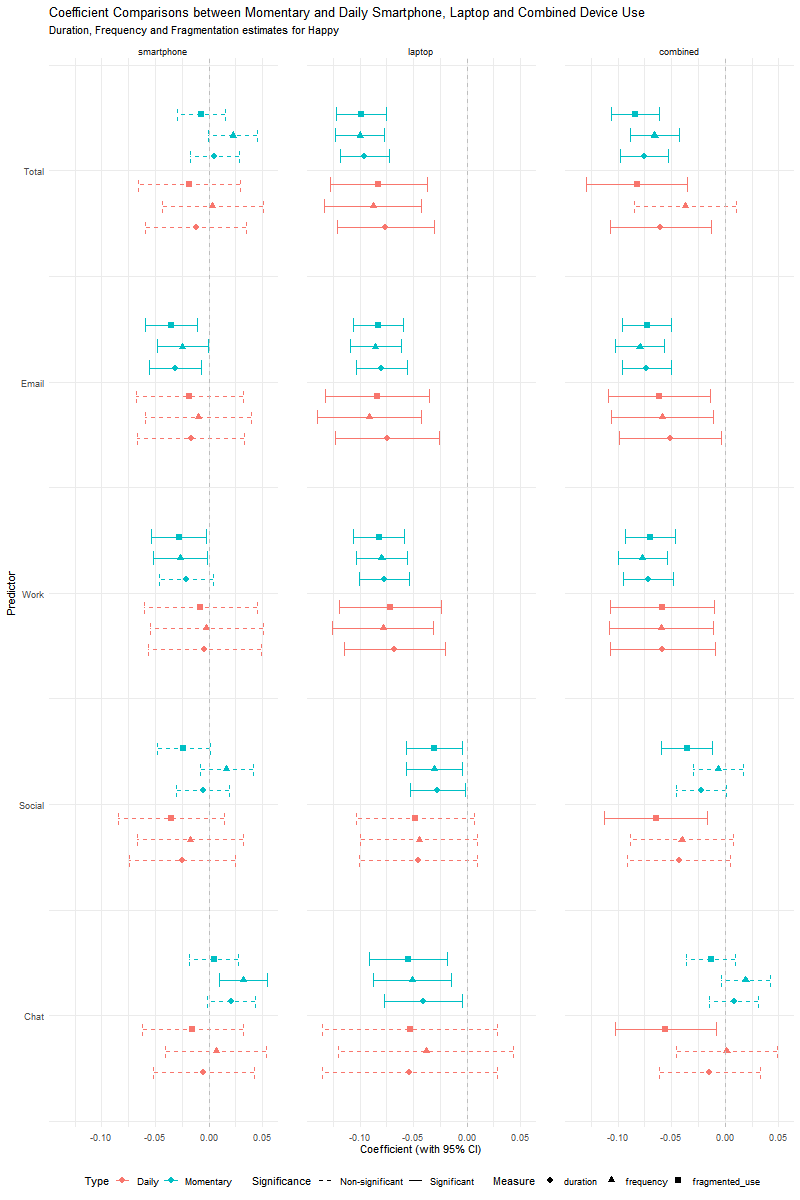
The figure is organized in three columns by device type (smartphone, laptop, combined) and five rows by category of use (total, email, work, social, chat). Within each cell, standardized coefficients are shown for duration, frequency and fragmentation (diamond, triangle, square) at both the momentary (blue) and daily (red) level. Solid lines indicate significant associations; dashed lines indicate non-significant effects.
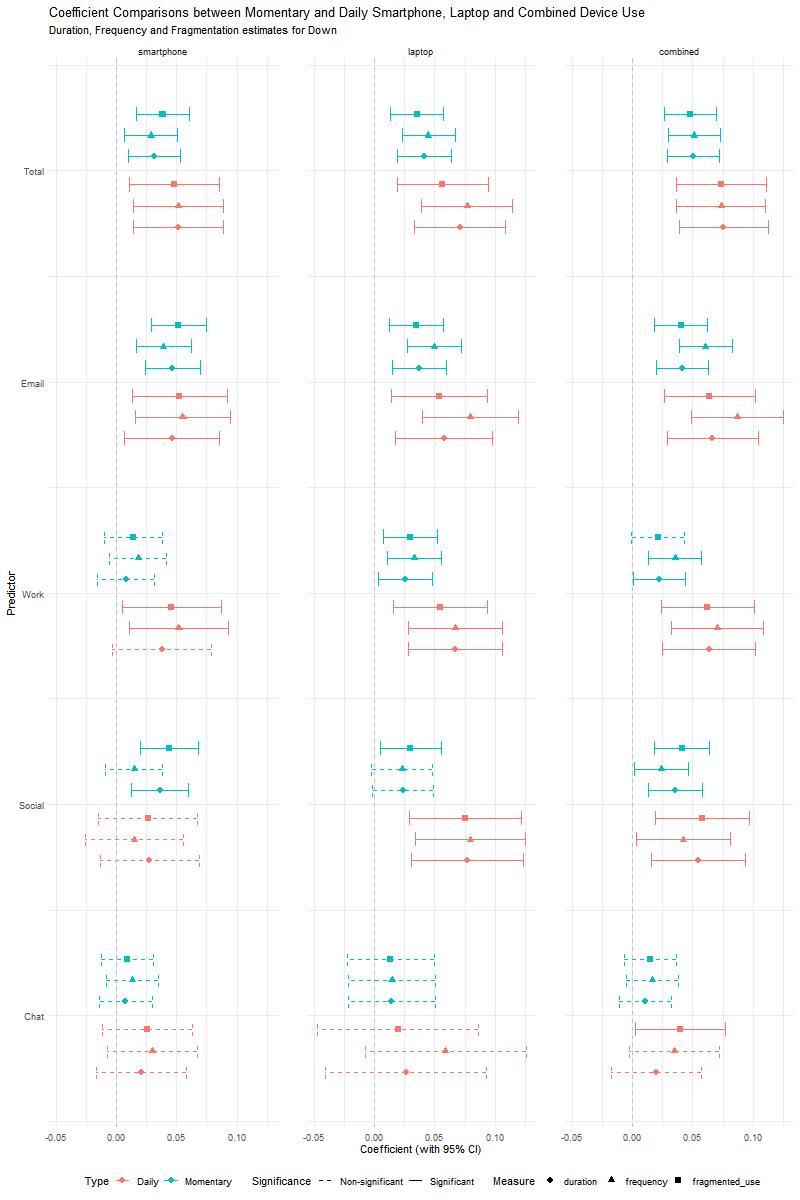
Mirrors Figure 5.5, reporting associations with feeling down across device types, usage categories, metrics and temporal levels.
Finally, we examined cross-device dynamics, which describe how devices are used together rather than separately. Table 5.1 and Table 5.2 contain the output of our cross-device models predicting feeling happy and down. Here, patterns were very consistent: more frequent device and context switches, as well as a greater overlap between smartphone and computer use were all associated with lower happiness and higher feelings of being down.
| Feature | β | 95% CI | p | level |
| Switches | -0.070 | [-0.093, -0.046] | .000 | Momentary |
| Context switches | -0.068 | [-0.091, -0.044] | .000 | |
| Overlap % (phone) | -0.070 | [-0.094, -0.046] | .000 | |
| Overlap % (computer) | -0.039 | [-0.063, -0.016] | .001 | |
| Switches | -0.073 | [-0.119, -0.027] | .002 | Daily |
| Context switches | -0.079 | [-0.125, -0.033] | .001 | |
| Overlap % (phone) | -0.071 | [-0.117, -0.025] | .003 | |
| Overlap % (computer) | -0.027 | [-0.073, 0.019] | .257 |
Fixed-effect estimates from mixed-effects models examining the associations between cross-device use and happiness at the momentary and daily level. Standardized coefficients, 95% confidence intervals and p-values are shown.
| Feature | β | 95% CI | p | level |
| Switches | 0.035 | [0.012, 0.057] | .003 | Momentary |
| Context switches | 0.031 | [0.008, 0.053] | .007 | |
| Overlap % (phone) | 0.024 | [0.001, 0.046] | .037 | |
| Overlap % (computer) | 0.029 | [0.007, 0.052] | .011 | |
| Switches | 0.069 | [0.031, 0.107] | .000 | Daily |
| Context switches | 0.079 | [0.041, 0.117] | .000 | |
| Overlap % (phone) | 0.049 | [0.010, 0.087] | .012 | |
| Overlap % (computer) | 0.047 | [0.009, 0.085] | .016 |
Fixed-effect estimates from mixed-effects models examining the associations between cross-device use and feeling down at the momentary and daily level. Standardized coefficients, 95% confidence intervals and p-values are shown.
These results suggest that the coordination of digital activity across devices, through rapid transitions, multitasking and overlapping attention, may be more psychologically consequential than total use duration. The negative associations align with theories linking attentional fragmentation to cognitive depletion and possible reduced emotional recovery (Brinberg et al., 2023; Siebers et al., 2024). Importantly, such patterns could only be observed through multi-device data.
In sum, including computer and cross-device data altered the inferential conclusions we could draw. This demonstrates that the scope of measurement, the devices and dynamics included, shape the conclusions we draw about media use and wellbeing. By moving from single-device to multi-device models, we obtain a fuller picture of digital behavior, as well as a different understanding of how this behavior related to emotional outcomes.
5.5 Discussion
The main goal of this paper was to examine how the inclusion of computer log data alters conclusions about in digital media effects research. Research on media effects has increasingly embraced smartphone-based log data to overcome the limitations of self-reports, yet this smartphone-centric approach risks underrepresenting people’s total digital engagement and obscure how people’s media behaviors take place across devices. By integrating smartphone ánd computer log data, and combining these data with experience-sampled mood reports, we highlighted that extending the measurement scope to multiple devices, both descriptive estimates of screen time as well as inferential patterns linking media use to affect can drastically alter. These findings demonstrate that the conclusions we draw about emotional consequences of digital media use will depend on which parts of a persons’ device ecology we capture.
With our descriptive findings, we have shown that computers matter: The amount of screen time spent on these devices, especially in the case of knowledge workers, greatly contributes to the total engagement with digital devices, even eclipsing the time spent on the field’s main focus, the smartphone. In our sample, total screen time roughly doubled when computers were included. Beyond this overall increase, including a secondary device revealed notable domain-specific differences. Certain categories of use – such as email or work – were much more present on the computer. Even in categories of use typically related to smartphones we saw large cross-device activity. For example, more than one third of all social media screen time occurred on computers, illustrating that people often distribute the same activities across multiple devices, rather than confining it to a single one.
The inclusion of computers does more than change how much - or what kind of - media use we measure; it allows us to reshape our understanding of how people use these devices. As research on, for instance, media multiplexity (Haythornthwaite, 2005), engagement with multiple devices is not neatly partitioned in separate sections, but rather dynamically shifting throughout the day. By introducing cross-device dynamics such as device switching, context switching and overlapping use, we can move beyond more “static” indicators of screen time and try and capture these more temporal dynamics. Our analyses revealed that cross-device use was not some occasional occurrence, but rather a defining feature of how people shape their daily digital practices. On average, participants switched more than sixty times per day, with these types of transitions happening on the majority of study days. Most device switches also entailed a context switch, meaning users changed both device and activity (e.g.: from composing an email on their computer to writing a chat message on the phone). Finally, overlapping use was also common. When both devices were active on a given day, nearly one fifth of computer use and one seventh of smartphone use overlapped with the other device. Together, these findings reveal a more dynamic pattern of digital behavior that single-device studies cannot capture, and is likely to shape how media use relates to affective well-being.
Our inferential results, finally, show that expanding the measurement scope from one to multiple devices meaningfully reshapes the conclusions we can draw about the link between media use and affect. In line with previous research, models using only smartphone data revealed few and inconsistent within-person associations with mood (Winbush et al., 2025). When computer-based metrics were added, however, much more consistent results were found for the adults in our sample: higher levels of computer use, and especially for work and email related activities, were associated with lower happiness and higher feelings of being down. Importantly, cross-device features showed similar and even slightly stronger associations with mood, indicating that coordinating activities across screens may be more consequential that total use alone.
Of course, our study is not without its limitations. First, participation in computer logging was an optional step in the broader data collection process, introducing an element of self-selection bias. It is very likely that participants who opted to install the additional software may differ systematically from those who did, perhaps because they felt rely more on computers for work or perceive their computer use as more impactful for their digital well-being. This means our sample might overrepresent participants with strong computer engagement. Nevertheless, there was substantial heterogeneity within this group of participants: some provided data of their main work computers, others from private laptops or even gaming desktops, resulting in diverse and informative usage patterns.
Second, our analytic sample was small and consisted mostly of adult knowledge workers. We cannot claim these data are very representative of a broader population, even though the data were intensive in both time and measurement resolution. As the goal of this study was primarily methodological, illustrating how including additional device could alter the conclusions we draw from these types of data, rather than make population-level claims about specific effect sizes.
Third, our approach focused on the inclusion of a single, but crucial, device. While adding computers represents an important step towards a fuller account of people’s total digital lives, it still leaves out tablets, wearables and other digital devices. As personal device ecosystems continue to expand, the question is not only whether but how far researchers should extend the boundaries of digital log collection. Addressing this complexity may require a shift towards far more individualized, within-person approaches. An n = 1 modelling perspective, where each participant’s digital ecosystem can be modelled in relation to their own mood dynamics, could better take into account the heterogeneity of device configurations and media habits. Such idiographic models would allow researchers to detect patterns which hold for certain individuals and to identify which forms of digital engagement are most relevant for each user. This aligns with a growing call for more personalized and context-specific models of digital well-being (Valkenburg et al., 2021; M. M. P. Vanden Abeele, 2021).
5.6 Conclusion
In sum, our findings demonstrate that computers matter. Extending log-based measurement beyond the smartphone fundamentally changes both what we capture and what we conclude about media effects and mood. Multi-device data reveals that people’s digital engagement are dynamic and distributed across screens, properties not adequately addressed in single-device approaches. Accounting for cross-device features improves not only the validity of media effects research, but also opens up new possibilities to model individual differences and bring in more contextual nuance in how our relationship with digital devices relates to our well-being. Embracing multi-device and person-centered approaches will be essential for building a more accurate understanding of digital media effects.
5.7 Data Availability
Anonymized data, materials and code used for this study can be accessed on our Online Science Framework (OSF) page: https://osf.io/fzmjx/overview?view_only=3e80e078d4354722a2a6773cb6479d34.
5.9 Funding
This study was funded by the European Union’s Horizon 2020 research and innovation programme under the European Research Council (ERC) Starting Grant agreement “DISCONNECT” No. 950635, and by the FWO under COSTOF24/7 No. G075524N.
Manuscript under review as: Van Gaeveren, K., Murphy, S., de Segovia Vicente, D., & Vanden Abeele, M. (2026). Computers matter: The relevance of computer log data for understanding associations between digital media use and well-being [Manuscript submitted for publication]. Department of Communication Sciences, Ghent University.↩︎
Detailed methodological information provided on https://osf.io/fzmjx/overview?view_only=3e80e078d4354722a2a6773cb6479d34. Here, only pertinent methodological information provided.↩︎